Pilot test on silica removal for Nestle Chachoengsao -Thailand
EEC-PILOT_NESTLE-THAILAND_14.06.2015
The Pilot Report: EEC Nestle Bangkok
1. The samples from Nestle factory in Bangkok, Thailand, arrived at our factory on the 11th of June
2015, after it was released by the environmental ministry.
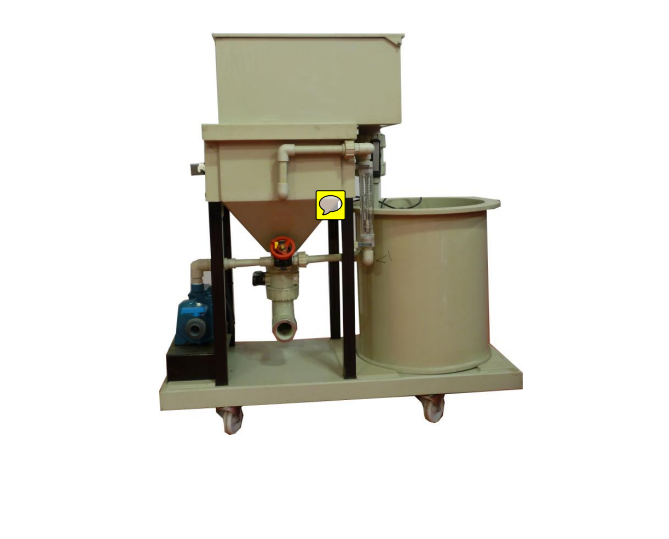
Fig 1. The EEC pilot system sketch.
2. We received 3 samples of 15 liters each;
a. A sample from the raw water tank
b. A sample from the brine pond
c. A sample from the reject evaporator
Note: only on the raw water sample it was written that the sample was the raw water. The
2 other samples did not indicate where the water came from.
Therefore, we determined that the raw water sample will be sample “A” (as it was indicated in the
tank), the light yellow sample is “B” and the darker sample is “C”.
Fig 2. The water samples – BEFORE the pilot test
C A B
Fig 3. The water analysis before the EEC pilot operation.
Note: since the water of sample C was so polluted and arrived at our laboratory after ~2 weeks it was
already contaminated and not stable enough to measure the silica level in the sample.
3. On the 14th of June 2015, we executed the EEC pilot while working with different levels of pH to find the most effective pH level in which the silica is at its maximal removal.
We then found that while using a pH level of ~10, the silica was at its maximal removal.
4. The tests were made with a one-through flow of 5 liter/hr.
5. The tests also included various variations of electrodes – aluminum, aluminum/aluminum,
aluminum/iron, iron, iron/iron.
The best results were received while using aluminum electrodes and while using reverse
polarity.
We also executed tests with different voltages and current levels.
Fig 4. The Silica results after the EEC system operation
As you can see in the table in Fig 4, the EEC system is capable of removing
almost all the silica from the water.
Test A B C
Conductivity µS/cm 1,268 11,080 (above 20 mS)
pH =470 <487 =498
TDS ppm ;89 ::< –
Silica ppm 884=0 7<4:0 –
Appearance Clear yellow Light yellow Dark brown
Test A B C
Silica ppm 0 0 9.80
Appearance Clear Clear Clear yellow
Fig 5. Example of the water samples – BEFORE & AFTER the EEC treatment
Fig 6. Sample C – during the process of the EEC system
Note: the high concentration of foam indicates that the sample contains many organic
substances.
Fig 7. The sample after the EEC treatment and during the precipitation on the stirrer
A B
6. The distance between the electrodes in the pilot system may not be the distance in the real-size EEC
system.
The distance between the electrodes in the real-size EEC system will take into consideration the van
der Waals forces, which is expected to accordingly improve the results.
Fig 8. The Van Der Waals Forces Graph
7. Elgressy will design the full-size EEC system, electrodes, power supplies, parts, cell dimensions,
weight, sketches, etc after we receive the purchase order.
Best Regards,
Elgressy Gaby


Leave A Comment